Yesterday UK House builder Persimmon posted results and despite the fact that the share price has halved since pre Pandemic, the share price fell a further 12% yesterday. What is perhaps surprising is that the stock price rallied as much as it did before yesterday’s announcement given what the market might have known and what management said.
For years now we have been extolling the obvious virtue of knowing where value is at any point in time – looking at the expected returns and the discount rate being applied to those cash flows.
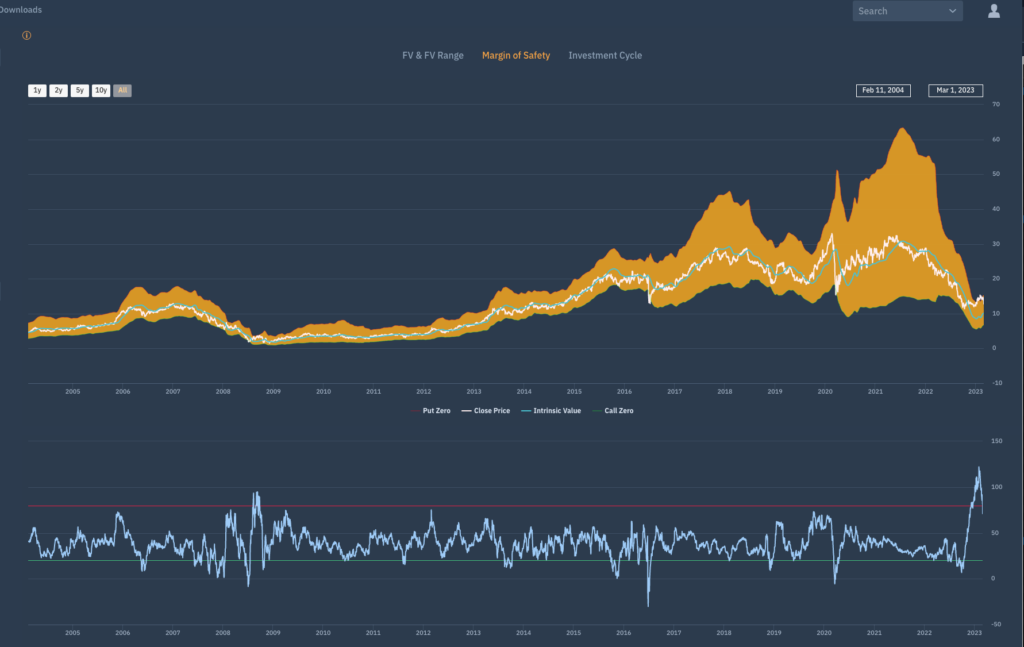
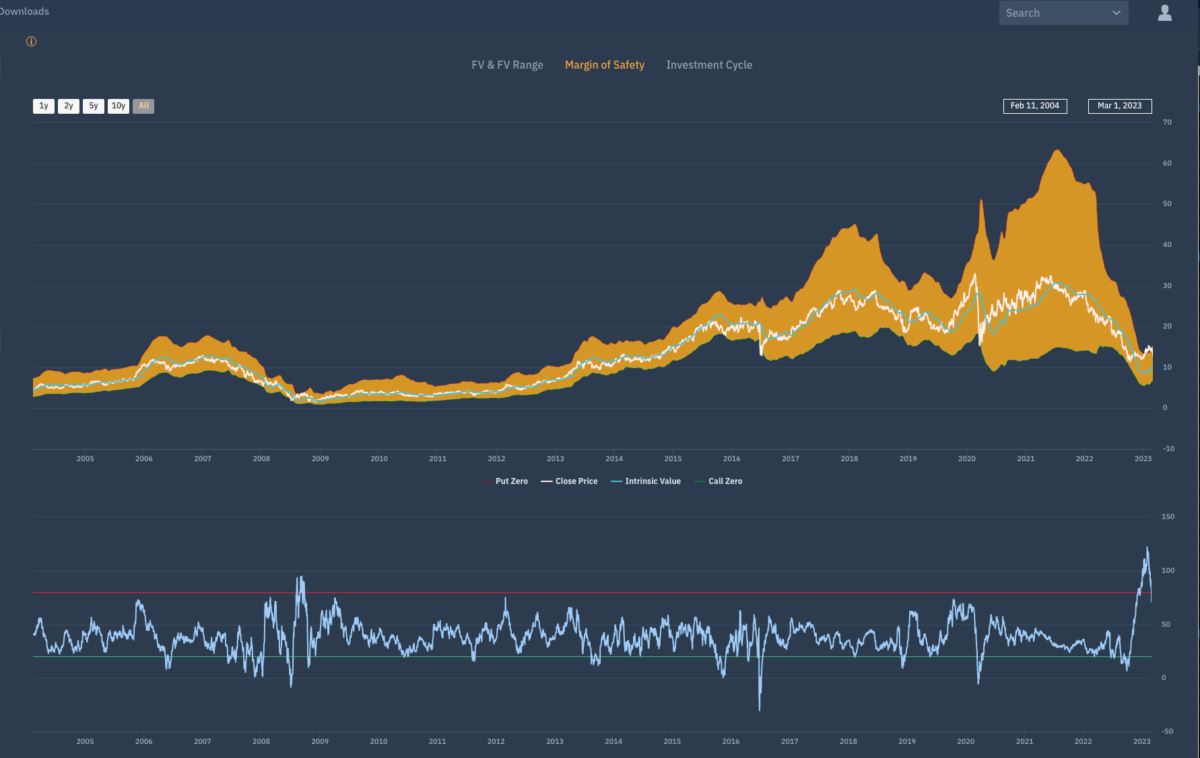
There is no better example of the importance or knowing this information and acting upon it so this is a good time to post this Margin of safety chart on PSN.

Apologies if this is not the easiest to see but the lower chart is the Value Indicator score that shows where the shares are trading in relation to the longer term expected return at any point in time and as can be seen the shares have been trading at the highest premium to Value since 2008 – a time when, despite being in the middle of the GFC, the shares were significantly overpriced and the shares fell as they did yesterday.
Just because share prices halve doesn’t mean they are cheap if the expected return has been falling – especially when you can see that return as has been falling, hence the need to know where the Present Value of the shares at any point in time.
The boundaries of the Margin of safety correspond to the price levels at which the “premium” for a put or a call decay to zero, and are referred to as CallZERO and PutZERO in the database – recently PSN was a ‘PutZERO’ i.e a free put option. If ever there was a sign….

