


We call our regular Apollo based commentary “The Weather report”. The analogies that we can make with the multiple elements of Value, Momentum and Uncertainty impacting markets in a continuous way chimes nicely with the idea of Currents, Tides and Winds, all impacting the navigation of the high seas. Whatever the nature of the vessel concerned or the skills, experience and capabilities of the crew, the Maritime Weather Report is an essential part of the information system that is required and so the Market Weather Report is designed to perform a similar, essential function.
Having provided an interim report in June following our regular (two monthly) rebalance, the outlook into the summer was for one of relatively smooth sailing as the credible performance of the first half did not require us to “put out all sails” in an attempt to catch up in performance terms. This allowed us to run with essentially unchanged strategies beyond our periodic rebalancing of the portfolio’s factor risk exposures back to neutral, and retaining our regular stock (re)selection approach, using Apollo’s risk adjusted expected returns forecasts.
Weather Forecast
Despite ongoing headline discussions about an over-concentration in US stocks, it remains the case that most returns observations regarding equities still look to the US S&P500 benchmark as the default “representation” of equity market returns. At time of writing, year-to-date (YTD) returns for the S&P500 price index are (+8.7%) whilst the S&P 900 – a universe that includes both the S&P 500 stocks plus the S&P400 US Mid Cap stocks – has risen by (+8.6%) over the same period. Worth noting here is that the equal-weighted S&P500 is up (+7.4%) YTD whilst an equal-weighted basket of the Mag-7 stocks is only up (+4.7%) YTD. Clearly these are not terrible returns by any stretch of the imagination, but as we noted previously, most of this net positive return only came at the end of June. Such seasonal factors are not uncommon, as window-dressing and quarter-end/half-year end rebalancing take place, but the fact that by as late as June 20th the S&P500 was still flat YTD (and the equal weight Mag-7 basket was flat YTD right through the end of June) gives cause to wonder how much underlying support these recent returns may have.
That is not the case for the Global S&P1200 (which includes the S&P500 stocks but adds in 700 other large Cap stocks) which had recovered its YTD returns by the start of May and was up (+8.9%) by the end of June and stands at (+11.65%) YTD in US$ terms. (For reference, the MSCI All world Index returns are essentially identical to this.) There is something of an FX impact here, given the (-9.5%) YTD decline in the Trade-Weighted US Dollar (TWD) although the TWD is basically flat since late April so we would not over state that effect. Nonetheless, this relative outperformance is an underpinning narrative for the recommendation of further diversification away from US-only exposure in equities.
Smart Alpha returns
In terms of what we see from our own strategies, the policy approach of factor-level risk management and active stock selection from within these universes (S&P500, S&P900 and S&P1200) has provided a far better return profile for each of these groups of stocks. For example, the 48-stock portfolio selected from the S&P500 is up (+16.95%) YTD and had recovered its positive YTD performance by late April whilst the Mid/Large Cap universe-based portfolio is now (+19.76%) YTD – having similarly recovered its positive returns by mid/late April. Both strategies were rebalanced in mid-April under the Smart Alpha models; implying that the active (systematic) decision to rebalance based on both risk and reward as opposed to either freezing in the headlights or simply remaining passive was the correct one.
This is not just about the returns. The YTD lows for the S&P500 were on April 8th when the index was down (-15.3%) YTD whilst the related Smart Alpha Strategy was “only” down (-9.9%) at that point. Recovery back to positive returns was therefore much easier to achieve. This was even more notable in the case of our Global S&P1200 portfolio. This 48-stock multi-factor portfolio is up (+24.13%) YTD against the benchmark of (+11.65%) but was only in negative territory for less than a week in the immediate aftermath of the April 8th lows. It is also evident from examining the Factor sub-portfolios that we build as part of the process that there has been a big Factor bias towards value (+37.1%) vs Growth (+12%) for our Global selection. As a reminder, when we construct a Smart Alpha portfolio, we not only rank stocks based on our risk adjusted expected returns, but by investment factor category. This is a crucial part of the risk management process embedded within our portfolio construction. At each rebalance we construct a 48-stock equal weighted portfolio with equal investment factor exposures to the factor(s) concerned. For example, we can construct a simple “Quality portfolio” by selection from stocks that Apollo categorises as Quality or a “Value portfolio” with equal exposures to Value and Deep Value stocks. We can also construct a factor neutral portfolio with equal exposures to Deep Value, Value, Quality and Growth. This ensures that there is no unintended or persistent factor bias embedded in the portfolios and this is the policy followed by the multifactor portfolio discussed here.
Digging into this further, the outperformance of Value was NOT just because of the sell -off/recovery after April but because of the Value outperformance in January and February that simply saw returns compounding to the sub portfolio throughout the following period. The divergence in factor performances can be seen in the table below.
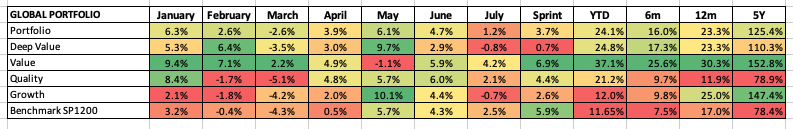
Compounding matters
Looking at the performances of the portfolios on our website https://www.libra-is.com/strategies) highlights how, relative to benchmarks, the strategies have performed so far this year and over 1, 3 and 5-year periods. A clear relative underperformance of Growth versus Value across both large cap and mid/large cap US stocks suggests that even though the focus was often upon the Mag -7 stocks, size was also an issue when related to investment factors. After the dominance of growth in prior periods in the US markets, this strong recovery in value had certainly gained attention but the YTD performance of Mid/Large Cap Value versus Large Cap value saw a (+21.8%) vs (+15.3%) difference, and the opposite divergence in Large Cap growth (+10.13%) vs Mid/large Cap growth (+6.34%). Mid Cap stocks have clearly been the focus of this factor shift.
A run towards ‘Labor Day’
As we highlighted in our Mid-June report, our S&P500 forecast portfolio had a 2-month period forecast return (to mid-August) of (+6.6%) with a possible upside of (+13.4%) and a downside of (+0.4%). This “low risk of loss” scenario with a Worst-Case Scenario (WCS) that was still a positive return is not a particularly common outlook, so we took that as an indication that we were heading to calmer conditions generally. With the Sprint’s return to date of (+2.0%) we are currently towards the lower end of that spread compared to the benchmark’s to-date return of (+4.9%), but after the strong portfolio performance through H1, we are not uncomfortable with that. Beyond the Value driver we have already identified, this relative underperformance also reflects the fact that we are now into the July reporting season. After an initial flurry of (generally positive) Technology sector and Mag-7 related results that lifted the benchmark higher, we are now in a quiet (summer) market period with little really happening on a day-to-day basis. This is often the case for July, and although it is always possible that we could see a repeat of the August 2024 VIX dramatic spike (and subsequent market drop), it is not unreasonable to assume that we will trend into our next periodic rebalance in Mid-August with a similar degree of relative calm. Absent the “unknown-unknowns” of geopolitical risk, the seasonal summer run into the US Labor (sic) Day weekend (1st September) is likely to see the current “melt-up” of equity markets continue to put stress upon those looking to leverage a declining VIX in search of short-term momentum.
We noted in a previous posting that we had been able to Sail (not sell) in May and that the June rebalance would allow us to build on performance YTD and enable us to continue to sail relatively serenely onwards. Unlike those who have had poor or negative performance so far this year, we have not had to “put out all of our sails” (increasing risk via either factor bets or stock specific long/short bets) in an attempt to recover performance and boost returns. We have stayed with our processes and run with the existing currents, tides, and moderating winds. As the latest reporting season carries the markets forward, the returns to Quality, Deep Value and Growth may be lower than those returns deemed to be “rewarding rubbish” or squeezing shorts on news flow (we would consider a fair degree of these stocks to be Deep Value or Value stocks and potentially of investable interest) but we are ok with that.
(You can find details of all of our Strategies on our Website https://www.libra-is.com/strategies)