

One reason that we call this report “The Weather report” is that the analogies with multiple elements of Value, Momentum and Uncertainty impacting markets in a continuous way chimes with the idea of Currents, Tides and Winds, all impacting the navigation of the high seas. Whatever the nature of the vessel concerned or the skills, experience and capabilities of the crew, the Maritime Weather Report is an essential part of the information system that is required and so the Market Weather Report is designed to perform a similar, essential function.
Such analogies can only go so far, but in a sense what we have experienced in April’s markets may not have been the “…end of something” as we alluded to last month so much as “…the beginning of another thing”. In maritime weather terms, it is as if we have just navigated around Cape Horn – from the Atlantic into the Pacific. We are in a new Ocean now where the winds tides and currents that we now face may not be that different from those we know and understand, but until we experience them first-hand, we will need to be very careful indeed to understand the kind of weather systems that await us.
The Weather Forecast
From an Apollo perspective, successful investing comes from selecting assets that match the current outlook for positive returns where possible and with a higher-than-average of probability of coming true. Not every quarter can deliver 20%+ annualised returns but it doesn’t seem unreasonable to at least target a 4.75% asset return over a three-month time frame at the outset of the period, where the valuation or earnings story might support it. By taking a view on the outlook as well as the degree to which the market may be under/over-estimating the longer-term outlook (we calculate a Margin of Safety measure for every stock) we can construct not only a “Weather Report” but a “Weather Forecast” for the market.
“…what was that all about?”
In the previous weather report (Q1 2025) the impact of much of what had occurred over the first three months of the year was dramatically eclipsed by the storm that hit the markets in early April. The sense that we were seeing the “end of something” was all too prevalent as the economic consequences of “Liberation Day” were forecast to lie somewhere between catastrophe and disaster by most commentators. Yet as we noted last month, “…against a backdrop of widespread calls of an overvalued market in 2024, a focus verging on paranoia about the overconcentration of risk in the Mag-7 stocks and the uncomfortable reality of US stocks accounting for over 70% of global indices, this correction has been treated as some form of unmanageable event that will destroy the global economy. Spoiler alert: it won’t”.
The stresses that we witnessed (and the many that remained below the radar) across all financial markets were undoubtedly severe last month, but the rally in response to an easing of economic and market tensions has restored the markets to relative calm as we enter May. Indeed, there is a sense of “…what was that all about?” beginning to take hold. An equal-weighted ETF basket of the “Magnificent Seven” (MAGS) is now (+17%) above its 8th April lows and essentially at the same level as it closed on 2nd April. Note too, that with the MAGS basket having returned (+17% ) over the last twelve months (at no point did the rolling 12-month return figure become negative*) it has not exactly caused the wealth destruction of last month’s headlines. That said, MAGS is still (-18%) below its December 2024 highs, so the deflation of the Q4 2024 “Mag-7 bubble” that we were all warned about now appears to be a reality (although actually mostly due to Q1 events as opposed to April’s).
* based on daily closing prices.
A winning streak or a streaky win?
For the S&P500 Index itself, a nine day “winning streak” to last Friday marked the longest sustained daily rally since November 2004, although the index remains (-8%) below its 2025 highs and down (-5%) YTD. Still, most investors would have taken that after the first couple of weeks of April, so it does look like the “do nothing” trade appears to have paid off this time. Yet as the dust settles, the Monday Morning Quarter backs are out in force and headline comparisons are now being made about how international stocks (EAFE) (+14%) YTD have clearly outperformed the US benchmark in 2025 and that this might lead to some further diversification away from US stocks over the course of coming months. However, with both benchmarks essentially the same over 12-months (S&P500 +8.3%, EAFE 7.8 %) but starkly different over 5 years (S&P500 +95.5%, EAFE +53.6%), the risk of comparing the performance of the weekend games to the whole Season are once again wort highlighting. For Market participants as well as sports fans, there is clearly a need to focus upon both risk and reward over both the shorter and longer time horizons.
So how did Smart Alpha perform in April?
At Libra, we construct a series of “Smart Alpha” Equity portfolios that not only provide highly credible investment products but, by nature of their bottom-up construction and unique factor developed risk frameworks, provide us with valuable insights into where and how the balance of risk and reward are to be found at any point in time. (all of these Strategies can be viewed live on the Libra Website, here https://www.libra-apollo.com/strategies).
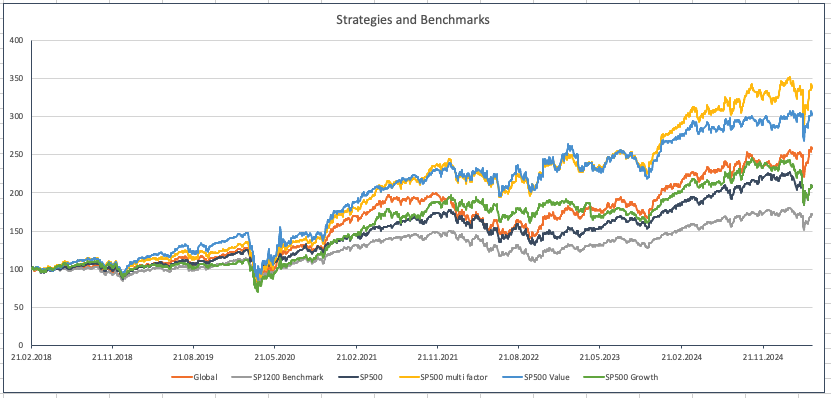
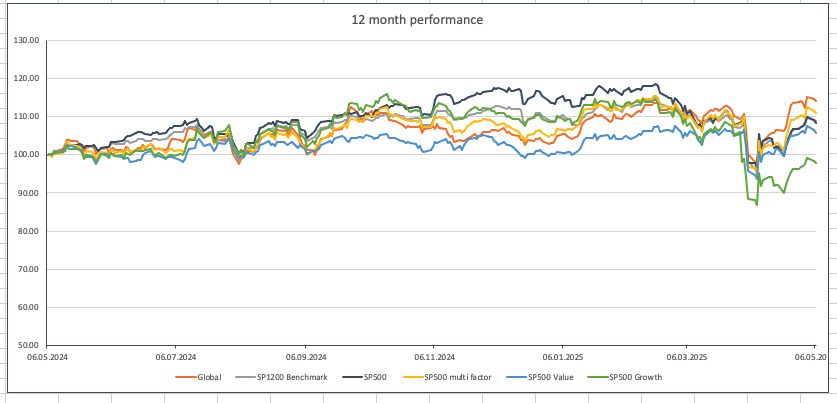
The combined chart above illustrates how a range of these strategies have performed over the last 7 years against the SP1200 and SP500 benchmarks (all in US$ and priced to the close 6 May 2025).
One of these insights comes from the regular rebalancing process. Each portfolio of (equally weighted) stocks is rebalanced every two months (in Mid-February, Mid-April, Mid-June etc.) into what we refer to as a fresh “Sprint”. The latest rebalance took place just over 2 weeks ago (so close to – but not actually at the lows of April) and provides some interesting context.
Being Global was the Smart move
To return to the EAFE versus S&P500 theme for a moment, we don’t tend to separate the US market out from the Rest of the World as, up until now at least, the integration of US-listed companies into the Global economy doesn’t seem to justify the artifice of the split (which we believe is largely driven by US-centric Asset Allocators who want to diversify geographically and don’t wish to indirectly create further exposure to US stocks).
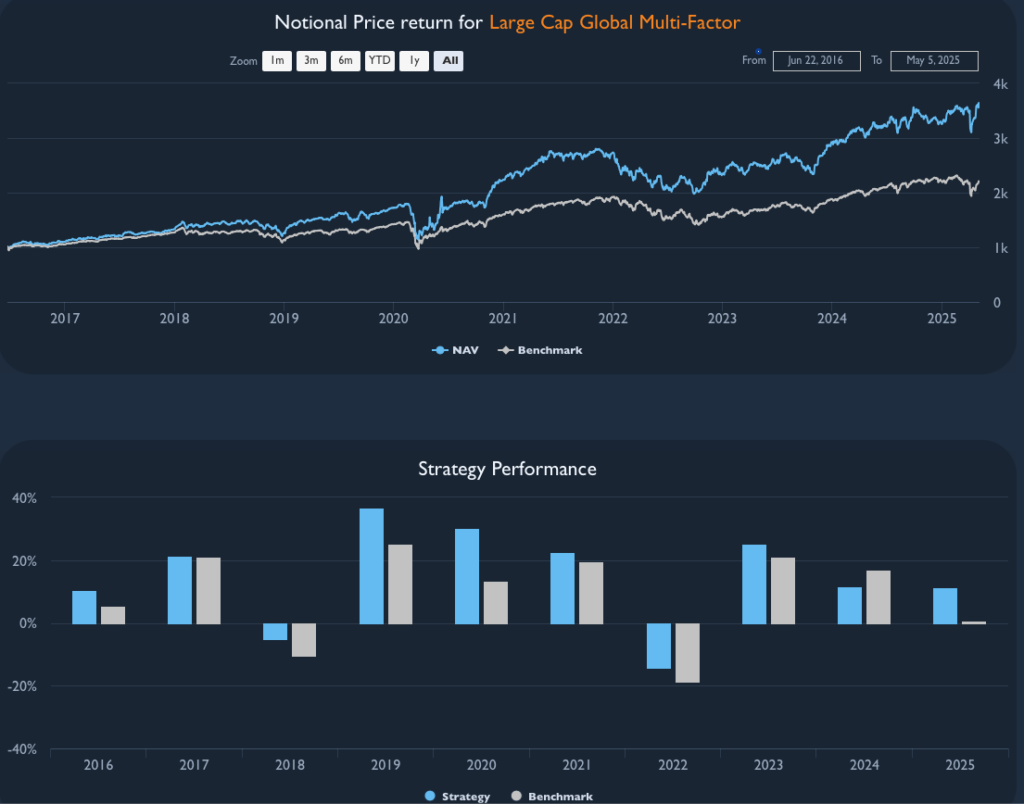
Given this, we have a Global Large Cap strategy portfolio of 48 stocks (selected from the S&P1200 Universe that obviously includes the S&P500 membership within it) that highlights how an international universe performed over the recent period.
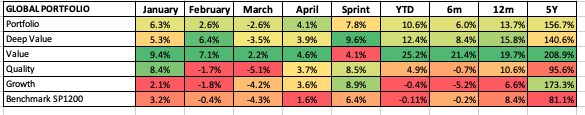
A (+4.1%) Return in April was certainly helped by the (+7.8%) return so far this Sprint, with just seven stocks showing negative returns (an 85% “hit rate”). As a result, this portfolio is up (+10.6%) YTD when compared to the Benchmark index (-0.11%) it shows how global diversification has helped not only over recent months but, to compare to the 5-year benchmark returns cited above, the Global Strategy is up (+157%) vs the S&P1200 (+81%) and far ahead of the EAFE and S&P500 benchmarks.
Focussing in on the USA
To narrow things down to the US component of this, the good news is that the Smart Alpha approach paid dividends here too.
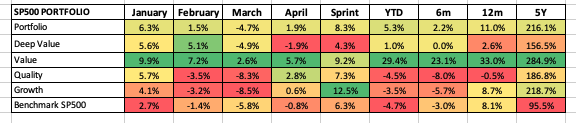
The 48-stock US large cap multifactor portfolio (Benchmarked against the S&P500) that we run is up (+8.3%) over the period (S&P500 +6.3%) but within that, only six stocks are showing negative returns – pointing to an 87.5% “hit rate” so far in this Sprint. Now this is obviously a short-term phenomenon (the longer-term hit rate is closer to 65%) but for wider context, we can set this against the other S&P500 benchmark figures highlighted above (+5.3%) YTD, (+11%) 12m and (+216%) 5-years. Not only does this suggest that Smart Alpha stock selection works in US Large-Cap but that (equal-weighted) concentration risk is a positive and not a negative when constructed systematically.
Tech trouble was actually a Q1 problem
Elsewhere, the impact of the Tech sector sell off was evident in the decline in the US innovation portfolio – a drop of (-13.3%) in March was particularly brutal – versus the benchmark NASDAQ 100 of (-7.7%) but the sector actually saw a (+4.6%) recovery in April as the new Sprint kicked in and a near (+20%) rise in Tech and Innovation Growth Stocks since then has helped restore its fortunes and its (+20%) rebound over the last month is significantly higher than the (+15% ) recovery of the NASDAQ100 that we tend to benchmark against. The end result is that, over the last 6 months of “Tech turmoil” (and since the Boom/Bust/Recovery of the November 5th Presidential Election results) both the Strategy and the Nasdaq 100 are essentially flat (-1% for both). The “Shock to growth” engendered by Liberation Day is likely to be more persistent now as the uncertainty premium for more intangible returns becomes a more built-in element to stocks and sectors where intangible earnings have become, well more intagible.
This sub-sector of the market perhaps more than anywhere else, is the “New Ocean” that we will now have to navigate through.
Whilst Factors highlight relative fundamental patterns of risk
From a factor perspective, our Growth stocks within the Rebalanced large Cap, Multi Factor portfolio are the outperformers in the latest Sprint period (+13%) whilst the relatively underperforming Deep Value are “only” (+ 5.5%) over the same horizon. The dedicated US Smart Alpha Factor universes that we also run have had similarly positive new Sprint performances : Value (+6.2%) since the Rebalance and leaving April at (+0.7%), Growth (+9.4%) so far in this Sprint to leave the April returns at +2.2%). From a YTD perspective, Value is up (+6.2%) – well ahead of a benchmark (-3.4%) whilst Growth is a more modest (+1.6% ) but still well ahead of the Factor benchmark ETF (-5.9%). In fact, both of these baskets have been not only outperformed healthily so far in 2025, but their performances have clearly been helped by the rebalance (and outperforming their benchmarks over the new Sprint period), reinforcing the point about the value of pro-active, dynamic factor identification and rebalancing as part of the Smart Alpha process.
A final observation that we can make is from the Value and Growth Factor baskets that we select from a slightly wider, US Mid/Large Cap universe. Here, a (-3.5%) April drop back in Value (following a (-2.8%) March decline was at least partly offset by the (+9.2%) return for the latest Sprint but leaves the YTD performance up (+1.1%) YTD (Benchmark index -3.3% YTD). For the Mid/Large Cap growth, a (+1%) performance in April was also boosted by the (+12.5%) post rebalance performance and, although the YTD performance is still negative (-2.4%) it remains ahead of the benchmark (-4.5%).
The comparisons that we can make here between Large Cap and Mid Large Cap Value and Growth baskets suggests that, given the relative underperformances of both our portfolios and their benchmarks for the Mid/Large Cap universes, relative liquidity may well have played a factor in terms of the ability to handle recent market dislocations.
A new Era – not Passive, not Active but, perhaps, “Pro-Active” investment?
So as we enter the “New Ocean” we are likely to see different relative patterns continue to emerge as concerns over the dominant role played by the S&P500 index in Global Investment Strategies leads to something of a focus away from the past. To be clear, this is not just about more or less diversification or stock selection. This is about the approach to Equity investment in general. So not only are we seeing a questioning of the role of the passive benchmark Market Cap weighted index, but we sense that there is a more “Pro Active” move towards Large Cap Global assets, more equal weighted (not Cap weighted) and more concentrated portfolios that extend beyond the top 500 US companies with a more global dynamic story to tell and a generally more dynamic approach to Factor risk management (Investing) within these emerging frameworks. We already have a name for this – Smart Alpha.