We are establishing a new category – Reader FAQ’s – to provide a quick and easy way of responding to questions arising from either the blog or from using the Apollo product suite.
We have recently introduced a new feature on the Apollo Edge platform that allows investors to “Smart Filter” their portfolios or watchlists at the stock level, using our proprietary investment factor groupings of Value, Re-rating, Growth or De-rating. Key to understanding our approach to investment factors is that not only do our stock level factor categorisations change over time – a stock is not always a “growth stock” or a “value stock”- but that these factors are dynamically determined on a stock-by-stock basis; reflecting how the market perceives/values a particular company at any point in time. Investment factors, in other words, are actually the factor elements of each stock’s Apollo expected return forecast and thus are integral to explaining how and why our forecast expected returns are dynamic and non-linear over time.
What this also means is that, collectively these groups make up our stock-level investment cycle analysis. This takes the Apollo discount rate – the second of the two factor elements of the present-value based Apollo asset pricing model – (1) the forecast future payoff (cashflow) and (2) the implied cost of capital (discount rate) – and models it as a multi-phased timeseries, with the factor groupings representing the different “phases” of the investment cycle where the discount rate is:
- – relatively high compared to history but set to fall (Value phase),
- – declining as investor confidence improves/cashflow prospects improve (Re-rating phase),
- – at significant lows as growth delivers strong cashflows and risk declines (Growth phase) and,
- – in reversal in the discount rate as the growth cycle slows/ return risk starts to increase (De-rating phase).
Our proprietary investment factor groupings of Value, Re-rating, Growth and De-rating collectively make up our stock-level Investment Cycle analysis.
This approach to factor analysis may appear controversial at first sight – after all, there is an entire industry built up around factor investing, with “standard factors” mostly being determined on a relative basis – often by ranked historic multiples (such as book/price) across a universe of stocks, with the top decile being value stocks for example. However, the whole approach taken by Apollo is to be systematic from the “bottom up” and, as such, an absolute measure of each factor is required. By making it clear that investment factors are not mere category labels, but an essential part of the forecast expected return and portfolio construction process, we can also use this phase analysis to help identify when a stock’s expected return is clearly directional or is likely to be unusually high/low.
One question that arises from our users is “…how long do these phases (and the Value phase in particular) last?”
Inevitably there is no clear answer as every stock case is different, but in broad terms, the average stock investment cycle mirrors that of an economic investment cycle – around 6 ½ years. Clearly each company will have a different duration pattern across the phases, but if we think about a typical economic/investment cycle having a broad expansion phase and a shorter, periodic contraction phase where the split is typically two-thirds to one third, then we can propose a theoretical guide. On this basis, we estimate that the Value phase – the early part of the expansion phase – could last up to 22 months as an early expansion gets underway and the market starts to respond to more visibility in terms of future cashflows by reducing the uncertainty premium and lowering the discount rate.
In reality, it is likely to be far shorter than that – often as short as 4-6 months. Note that this is not because a significant positive movement in the price stops a stock from being “categorised” as value on the basis of the denominator getting larger in a book/price multiple for example – but because the market “valuation response” to improving “cashflow” related news from an early expansion cycle is to markedly reduce the discount rate being “applied” by the market to the forecast future payoff. The falling /normalising discount rate then has the effect of stimulating a virtuous cycle where, even in the absence of clear and visible cashflow news, improved confidence is enough to prompt further share price gains; potentially leading to a move towards wholesale re-rating of the stock as supportive cash flownews feeds in..
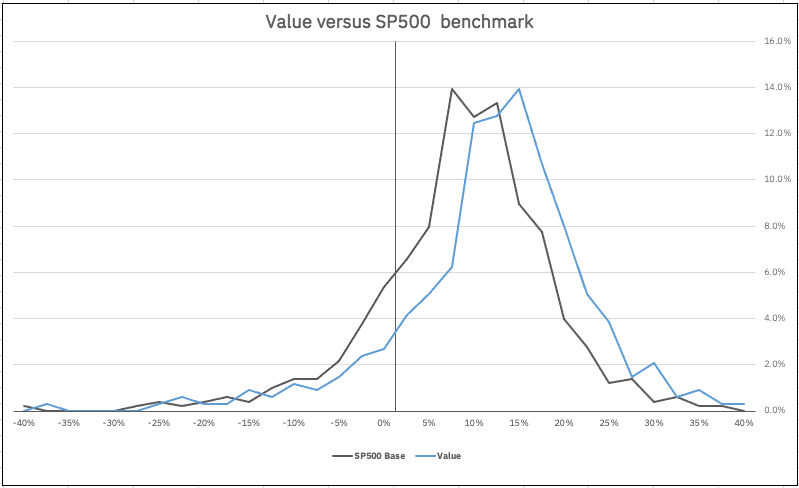
In any regard, the most important point to note is that value stocks as categorised on the Apollo factor basis, can and do generate excess returns when compared to other phase stocks – even in periods of strong overall market returns. The recent rally in the SP500 is a good case in point. Even with an average 20d realised return of 10.3%, the two thirds of the US market that are currently categorised as Value stocks showed an average return of 11.1% over the same period, with a clearly more positive distribution of those returns as can be seen in the chart of “Value versus the benchmark”.

This is ultimately the benefit of being able to see the factor phases for the investment cycle. Indeed, both the value and growth phases can exhibit such behaviour and can be considered “inflection phases” where price action is often significant (and non-linear) and the discount rate reacts accordingly; shortening the phase periods at these relative cycle extremes. (Note that this poses a potential (negative) change in risk for “late growth” stocks as excessive exuberance moderates and discount rates normalise higher with negative consequences for the share price.) Value may not last forever, but it’s certainly good whilst it lasts.

