Although the market has been enjoying a modest rally lately for a variety of as yet unsubstantiated reasons, the Apollo EDGE signal that we have been monitoring intently is the ‘Accelerator short.’ As a reminder to those that know us and as an introduction to those that don’t, here is a brief explanation;
The Apollo momentum signal is a measure of the momentum associated with inter-temporal changes in stock level expected returns and the consequent re-estimation of future expected returns by the market. We refer to this as the (momentum) accelerator signal.
It is designed as a three-step signal; identifying the implied direction of the trend in price action through the sign of the normalised scores for both the slope of Apollo FV (the shorter term time series) and the Apollo Intrinsic value time series (the longer term time series).
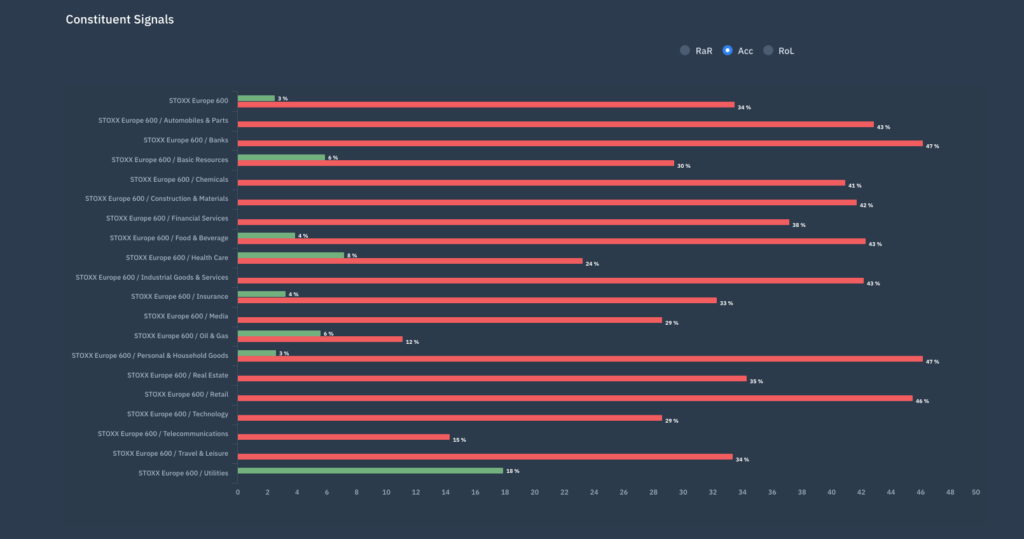
As with all things Apollo, the visual impact of our data is insightful and this is particularly true in this case where we show the breadth of the Accelerator short signal across the Stoxx Europe 600.

The chart tells its own story and it’s one that explains why we find investing in the market difficult at this point, although a good and rational start might be to review those stocks showing an Accelerator long signal.

